Thermal Sensors

A while back, I had a cooking timer/thermometer that I frequently used around the kitchen. It had a metallic pointed probe, approximately 15 cm (6 in) in length, that could be stuck in a roast or poultry. The probe was attached to a long insulated wire ending in a jack that plugged into the timer/thermometer allowing the temperature to be measured outside the oven and for an alarm to go off when a set temperature was reached. The device eventually stopped working and the probe stayed in the back of one of my kitchen drawers. Going through the drawer the other day, I found the probe and wondered if I could use it without the long gone device. I decided to study it to figure out what type of thermal sensor it was and how I could use it to measure temperature.

In this post, I will explain how I determined the type of thermal sensor that was used to manufacture my cooking timer/thermometer probe. I will then describe how to use the sensor and compute temperature from it. Finally, I will build a small circuit and Arduino program to measure temperatures using the probe and report it back to the computer connected to the Arduino. The featured image at the beginning of this blog post was slightly modified from an original published by Ulf Šustek Seifert, CC BY-SA 3.0 , via Wikimedia Commons.

Thermal Sensor Characteristics

There are several types of electronic temperature sensors. The four major types are thermocouples, Resistance Temperature Detectors (RTD), thermistors and other semiconductor-based sensors. Unlike the first three major types that describe classes of devices, each semiconductor-based sensor device has its own characteristics and modes of operation. They range from simple silicon bulk resistance sensors to complex hybrid analog/digital integrated circuits. In post Temperature and Humidity Sensor I used the complex hybrid analog/digital sensor DHT22 to measure temperature and humidity. Because my probe is more than likely one of the first three types of thermal sensors, this post will concentrate on them. Their characteristics will be described in the next sections in order to determine the temperature probe’s sensor type.

Thermocouples

A thermocouple is an electrical device consisting of two dissimilar electrical conductors joined at one end, producing a small voltage, V, between the two conductors when the temperature at the junction of both conductors, Tj, is different from the temperature at the other end of the conductors, Tref, as shown in the diagram below. The conversion of temperature differences into a voltage is called the thermoelectric effect. Thermocouples are self sufficient in that they do not need external circuitry to operate and the measured voltage between the two conductors can be used to compute the temperature difference between the junction and the other ends of the conductors.

Thermocouples are an inexpensive way to measure temperature. They are durable, sturdy and can withstand harsh environments. However, since they measure a temperature difference, a reference temperature is required to obtain an absolute temperature measurement. Moreover, precisions below 1 °C (1.8 °F) are difficult to achieve for temperature differentials below 130 °C (234 °F) and precisions below 0.75% for temperature differentials above 130 °C (234 °F). Hence, thermocouples are best used for applications that do not require great precision and for measurements of high temperature differentials such as gas furnaces, diesel engines and ultra low freezers. The resistance across a thermocouple when the junction temperature is identical to the surrounding temperature is typically less than 20 Ω. The following symbols are used to depict thermocouples in diagrams.

Resistance Temperature Detectors

Resistance temperature detectors (RTD) are electronic devices that rely on the change of resistivity of pure metals at different temperatures. As depicted below, these devices consist of long thin metal wires wound or affixed to an insulated substrate, such as glass or ceramic. The metal used is typically copper, nickel, or platinum, with a preference for platinum which has the most stable resistance-temperature relationship over the the widest temperature range. The resistance of metals increases with temperature. Other materials, such as carbon, are also used for ultra-low temperatures. In a typical application, RTDs are used with other reference resistors and a reference voltage to convert the resistance of the device to a voltage that can be measured.

RTDs are very accurate, typically ±0.03 °C (±0.054 °F) down to ±0.001 °C (±0.0018 °F) for ultra high precision devices. They are stable and suitable for high precision applications, but they are more expensive, especially the platinum based devices, and have a limited temperature range, typically −200 °C (−328 °F) to 500 °C (932 °F) for industrial applications. Furthermore, RTDs have slower response times and are less sensitive to small temperature changes than other temperature sensors. RTDs are best used for applications that require high precision temperature measurements at or below 500 °C (932 °F), such as in laboratories. Typically, RTDs come in two varieties: 100 Ω and 1000 Ω, their base resistance at 0 °C (32 °F). The following symbols are used to depict RTDs in diagrams.

Thermistors

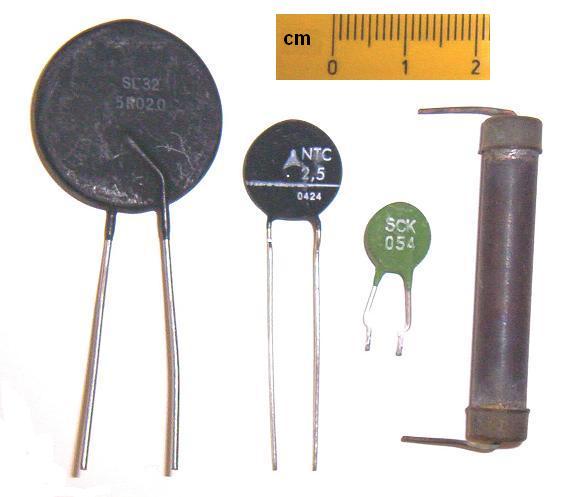
Thermistors are passive electronic devices typically made of ceramic in the form of compressed metal oxide or polymer shaped into disks or rods whose ends are attached to metal leads. The thermistor material is encased in a heat conducting but electrically insulating material. The electrical resistance of the material used within thermistors is highly dependent on temperature. There are two types of thermistor: devices whose resistance increases with temperature thus having a Positive Temperature Coefficient (PTC) and devices whose resistance decreases with temperature thus having a Negative Temperature Coefficient (NTC). PTC thermistors are mostly used in circuits to protect them against overcurrent conditions. NTC thermistors are mostly used for temperature sensing applications. As for RTDs, thermistors are used with other reference resistors and a reference voltage to convert the resistance of the device to a voltage that can be measured. The diagram below depicts the construction of a metal-oxide thermistor shaped as a disk.

Since we are interested in temperature sensing, we will discuss NTC thermistors. NTC thermistors have varying accuracies across temperature ranges. Metal-oxide thermistors are used for temperature ranging from −70 °C (−94 °F) to 400 °C (752 °F) while single crystal semiconductor thermistors are designed to be be used in ultra low temperatures, from 0.01 °K (−273.14 °C, −459.652 °F) up to 100 °K (−173.15 °C, −279.67 °F). Metal-oxide NTC thermistors can achieve fairly accurate temperature measurements over relatively small temperature ranges, typically ±0.1 °C (±0.18 °F) over a −40 °C (−40 °F) to 125 °C (257 °F) range. These thermistors are available in many resistance values ranging from 1 Ω to 5 MΩ, their resistance value at 25 °C (77 °F). NTC thermistors have good response times and are sensitive to small temperature changes. The following symbols are used to depict NTC thermistors in diagrams.

Determining Sensor Type

In order to figure out the type of temperature sensor that was used in the cooking timer/thermometer probe, I used a digital multimeter to measure the resistance across the leads at different temperatures and a cooking thermometer to provide a temperature reading. The very first measurement I made was at room temperature. The temperature was 23.7 °C (74.66 °F) and the measured resistance was 244.0 kΩ. From this first measurement we can readily say that the temperature sensor is neither a thermocouple nor a resistance temperature detector as the measured resistance is orders of magnitude higher than it would be for these sensor types.

I continued the experiment using a sous-vide precision cooker, a pot of water and a cooking thermometer. I installed the sous-vide precision cooker heating element, the cooking thermometer probe and the temperature sensor probe in the pot of water. I set the precision cooker to heat the water to 35 °C and took a first measurement when the temperature had been reached for at least 5 minutes. As the temperature was slightly changing over time, I measured the minimum and maximum temperatures and the minimum and maximum resistance values over 5 minutes and I jotted them down. I repeated the exercise, setting the precision cooker temperature and taking measurements for every temperature multiples of 5 °C (9 °F) until the precision cooker temperature reached 80 °C (176 °F). I computed the average temperature and the average resistance for each set temperature and wrote them down. The following table lists all temperature and resistance average values I obtained.

Temperature (°C / °F)Resistance (Ω)
35.0 / 95.0148 100
40.0 / 104.0119 400
45.0 / 113.097 050
50.0 / 122.079 300
55.0 / 131.064 950
60.0 / 140.053 435
65.0 / 149.044 280
70.0 / 158.036 765
75.0 / 167.030 670
80.0 / 176.025 370

As can be seen in the table, the resistance values decreased as the temperature increased. In other terms, the sensor being tested has a negative temperature coefficient. From this information, we can determine that the sensor within the temperature probe is an NTC thermistor. The following graph shows the temperature as a function of the thermal sensor probe’s measured resistance. As can be seen, it is not linear.

Resistance and Temperature Relationship

The relationship between the resistance of a semiconductor, such as a metal oxide, and temperature is well known. In 1968, John S. Steinhart and Stanley R. Hart proposed an equation that modelled very well the relationship between the resistance and temperature of thermistors. It is called the Steinhart-Hart equation and goes as follows:

1/T = A + B ln R + C (ln R)3

Where T is the temperature in degrees Kelvin, R is the resistance across the thermistor leads and A, B, and C are the Steinhart-Hart coefficients specific to the thermistor being used. In order to convert resistance to temperature, we must determine the values of coefficients A, B, and C. We need three temperature-resistance value pairs, that is the thermistor resistance value at three different temperatures to form a system of linear equations with three unknowns, A, B, and C. Let’s find the coefficients using the thermistor resistance values measured when the precision cooker temperature was set to 40 °C, 60 °C, and 80 °C respectively. Since 0 °C is equal to 273.15 degrees Kelvin, T1 = 313.15 °K, T2 = 333.15 °K, and T3 = 353.15 °K. The corresponding thermistor resistance values are R1 = 119 400 Ω, R2 = 53 435 Ω, and R3 = 25 370 Ω. Rewriting the Steinhart-Hart equation using the three resistance and temperature value pairs, we get the following system of linear equations.

A + B ln 119 400 Ω + C (ln 119 400 Ω)3 = 1/313.15 °K−1
A + B ln 53 435 Ω + C (ln 53 435 Ω)3 = 1/333.15 °K−1
A + B ln 25 370 Ω + C (ln 25 370 Ω)3 = 1/353.15 °K−1

or,

1 A + 11.690234 B + 1 597.6059 C = 3.1933578×10⁻³ °K−1
1 A + 10.886221 B + 1 290.1240 C = 3.0016509×10⁻³ °K−1
1 A + 10.141322 B + 1 042.9987 C = 2.8316579×10⁻³ °K−1

Solving the system of linear equations we get:

A = 7.3927571×10⁻⁴ °K−1
B = 1.9407191×10⁻⁴ °K−1
C = 1.1600851×10⁻⁷ °K−1

Substituting these values for the coefficients in the Steinhart-Hart equation, we get the following formula to get the temperature, T, in degrees Celsius, from the value of the resistance, R, of my temperature probe.

T = 1 / (7.3927571×10⁻⁴ + 1.9407191×10⁻⁴ ln R + 1.1600851×10⁻⁷ (ln R)3) − 273.15 °C

In order to check the precision of the equation, I used previously measured temperature sensor probe resistance values to compute the corresponding temperature. The following table shows the measured temperatures and resistance values, the computed temperature as well as the difference between the measured and computed temperatures, Delta T.

Measured T (°C)Measured R (Ω)Computed T (°C) Delta T (°C)
35.0148 10034.9597 −0.0403
40.0119 40040.00000.0000
45.097 05044.9716 −0.0284
50.079 30049.9367 −0.0633
55.064 95054.9643 −0.0357
60.053 43560.00000.0000
65.044 28064.9665 −0.0335
70.036 76569.9991 −0.0009
75.030 67075.02050.0252
80.025 37080.00000.0000

All computed values are within 0.1 °C of the measured values which is the precision of the cooking thermometer that I used. I further tested the precision of the equation using the very first temperature sensor resistance value, 244.0 kΩ, measured at room temperature, 23.7 °C (74.66 °F). Computing the temperature using the Steinhart-Hart equation, we get 23.7470 °C, a difference of 0.0470 °C, again, well within 0.1 °C of the measured value.

Converting Resistance to Voltage

As we did in post “A Light Activated Switch“, we will use a voltage divider as a mean to convert the thermistor’s electrical resistance into a voltage. The following circuit diagram depicts the voltage divider circuit and its connection to the Arduino micro-controller.

where the fixed resistor and the thermistor, RVD and RNTC respectively, form a voltage divider that divides the reference voltage, VRef, according to the formula

VRNTC = VRef RNTC / (RVD + RNTC)

We need to find a value for RVD that maximizes the voltage across RNTC for the temperatures we intend to measure with the thermistor. For this project, I intend to use the probe to eventually build a cooking thermometer and thus measure temperatures between 40 °C and 80 °C (104 °F and 176 °F). The voltage range across the thermistor between the chosen temperatures, ΔVRNTC, determined by the voltage difference when thermistor values are between Rlow and Rhigh, the thermistor resistance values at the lowest and highest temperatures. Using the formula above, the voltage range is

ΔVRNTC = VRef Rlow / (RVD + Rlow) − VRef Rhigh / (RVD + Rhigh)

If we plot the voltage range, ΔVRNTC, provided by the voltage divider for thermistor values between 40 °C and 80 °C (104 °F and 176 °F) as a function of RVD, we obtain the following graph.

In the graph, we see that there is a value for RVD that maximizes the voltage range for thermistor values between 40 °C and 80 °C (104 °F and 176 °F), thus maximizing the analog to digital conversion accuracy of the Arduino Uno. To find this value, we compute the first derivative with respect to RVD and find the value of RVD for which the derivative is zero giving us the RVD value for which the slope of the curve in the graph above is zero, corresponding to the curve’s maximum point. The first derivative with respect to RVD for the voltage range equation is

ΔVRNTC‘ = −VRef Rlow / (RVD + Rlow)2 + VRef Rhigh / (RVD + Rhigh)2

Finding the value of RVD for which this equation is zero, we get the value of RVD that maximizes the voltage divider voltage range ΔVRNTC.

The value of RVD determined using the formula above works when both Rlow and Rhigh are greater than 0. Since the thermistor resistance at 40 °C, Rlow, is 119 400 Ω and the thermistor resistance at 80 °C, Rhigh, is 25 370 Ω, we get

The closest Resistor value is 56 kΩ. The circuit now looks like the following

Breadboarding

The following picture depicts how to connect the different parts using a solderless breadboard, jumper wires, a thermistor, a 56 KΩ resistors, and an Arduino Uno micro-controller. In the schematic, I used a thermistor instead of the probe. Of course, wires connected to the sensor can be used in lieu of the thermistor depicted.

The Program

Here is the program that reads the thermistor’s voltage at the voltage divider, converts it to a resistance, then using the Steinhart-Hart equation, converts the resistance across the sensor to a temperature in degrees Celsius. The resistance across the sensor and the computed temperature are then returned to the connected PC.

/*
  Thermistor demonstration
  Program that computes the resistance across a thermistor and converts the
  value to a temperature. The temperature is then sent back to the connected
  PC through the serial interface. The blog post associated with this program
  can be found at https://lagacemichel.com
  MIT License
  Copyright (c) 2021, Michel Lagace
*/

// Steinhart-Hart equation parameters
const float zeroKelvin = -273.15;
const float coefA = 7.3927571E-04;
const float coefB = 1.9407191E-04;
const float coefC = 1.1600851E-07;

// Temperature voltage divider parameters
const float dividerResistor = 55440.0;
const float vcc = 5.011;
const int analogSteps = 1024;

// Wait time
const int oneSecond = 1000;

// void setup()
// Setup serial communication with connected PC.
void setup() {
  // 
  Serial.begin(9600);
}

// void loop()
// Repeatedly read sensor and return temperature to PC
void loop() {
  // Read voltage at the thermistor, convert to resistance, then to temperature
  float voltageR = analogRead(A0) * vcc / analogSteps + 1.0/(2.0*analogSteps);
  float resistance = voltageR*dividerResistor / (vcc - voltageR);
  float lnR = log(resistance);
  float temperature = 1.0 / (coefA + coefB * lnR + coefC * pow(lnR, 3.0)) + zeroKelvin;

  // Return thermistor resistance and temperature
  Serial.print("Thermistor resistance: ");
  Serial.print(resistance);
  Serial.print(" ohms, temperature: ");
  Serial.print(temperature);
  Serial.println(" C");

  // Wait one second
  delay(oneSecond);
}

After the standard program header, we declare the Steinhart-Hart equation coefficients, coefA, coefB, and coefC as computed in the previous sections above, and the value of absolute zero, zeroKelvin, in degrees Celsius. We then declare the values used in the voltage divider, measured using a digital multi-meter for maximum accuracy. We use the measured dividerResistor (RVD) and the measured Arduino board vcc (VCC). The number of steps in the analog to digital converter, analogSteps, is also declared. We declare the oneSecond constant to be used in the main loop to wait one second before starting a new iteration. The standard function setup() initializes the Serial communication channel and sets the communication speed to 9600 baud.

In the standard loop() function, we first read the analog input channel A0 taken across the thermistor and convert the analog step value to a floating point value in volts, voltageR. We use that value to compute the resistance across the thermistor, resistance. The temperature is then computed, using the Steinhart-Hart equation. The resistance and temperature are sent back to the PC using the Serial library. Finally, we wait one second before exiting the loop() function.

Putting It to Work

Build the circuit shown above and connect the Arduino Uno to your computer using a USB cable. On the computer, within the Arduino IDE, copy and paste the code above into a new sketch, compile and download the sketch then press the control, shift, and M keys simultaneously. This will make the Serial Monitor window appear. Every second, the Arduino program will send the temperature measured by the sensor as a character string back to the computer. The text is displayed on the Serial Monitor window and the output should look like the following:

What Next

Now that I have a way to use the thermistor sensor, I could build a standalone device, using the temperature probe, that would display the temperature at the probe and sound an alarm when a set temperature has been reached. In an upcoming post, I will discuss the construction of such a device.

Sensing Temperature and Humidity

In this post, we will create a circuit to connect a DHT22 temperature and relative humidity sensor to an Arduino Uno and write a class to read the information off the sensor. The sensor signal will be read directly without the use of a ready-made library, allowing the reader to better understand how such code is written. If you are interested in using a ready-made library, you can download one created by Adafruit Industries from the Arduino Libraries or have a look at the actual project on GitHub. The Arduino sketch and code associated with this blog post can be found here on GitHub. The featured image at the beginning of this blog post has been released into the public domain by its author, Fenners and was downloaded from the Wikimedia Commons.

The DHT22 sensor, pictured below, is a small 25mm by 15mm by 8mm white plastic device with slits and holes organized in a grate pattern on its front face allowing for the surrounding air to reach within the sensor. It has four metal leads allowing it to be electrically connected to a circuit. The leads, numbered 1 to 4, from left to right, have the following functionality. Lead 1 is VDD, the power supply, whose voltage must be between 3.3 volts and 5.5 volts. Lead 2 is the data signal lead. We will describe how data is requested and transmitted later on in this post. Lead 3 is unused and should remain unconnected. Finally, lead 4 is ground and must be connected to the power source ground.

Communicating with the DHT22

Communication with the sensor is achieved using the DHT22 data signal lead. The data signal lead is a bidirectional communication signal line. This means that the DHT22 sensor can receive and send information on this line. In it’s idle state, the sensor listens to the signal line waiting for a low, 0 volt, to be applied on the line for at least one millisecond by the Micro Controller Unit (MCU), the Arduino. 20 to 40 microseconds after the low signal reverts to high, the sensor sends a low, 0 volt, for 80 microseconds, then a high, 5 volts, for 80 microseconds to indicate start of transmission. The sensor then sends a series of low and high values, varying in duration, encoding zeroes and ones that will translate into numbers representing the temperature and the relative humidity. The following timing diagram illustrates this sequence.

The sequence of low and high values is similar to the dots and dashes that were discussed in the Morse Code Generator post. For Morse code, the duration of the dot, the short burst, is the unit of time by which all other elements of Morse code are defined. As can be seen in the DHT22 signal timing diagram below, a zero is encoded as a low value lasting 50 microseconds followed by a high value lasting 26 to 28 microseconds and a one is encoded as a low value lasting 50 microseconds followed by a high value lasting 70 microseconds. Thus, the unit of time is determined by how long the low signal lasts. A zero is detected when the low signal is followed by shorter high signal and a one is detected when the low signal is followed by a longer high signal. There are a total of forty of these low and high values forming a sequence of forty zeroes and ones, a sequence of forty bits.

Relative Humidity

The first sixteen bits, or binary digits, represent the relative humidity value in thousandths. The way binary digits work is the same as for decimal digits except that there are only two possible values for each digit, 0 and 1. The minimum relative humidity value is 0, 0.0%, and the maximum relative humidity value is 1000, or 100.0%. The decimal value for the maximum relative humidity value is interpreted thus:

1×10³+0×102+0×101+0×100,
1×1,000 + 0×100 + 0×10 + 0×1.

Each decimal digit represents the value of the digit multiplied by increasing powers of 10, from right to left. The same value represented using binary digits is 1111101000 or

1×29+1×28+1×27+1×26+1×25+0×24+1×23+0×22+0×21+0×20,
1×512 + 1×256 + 1×128 + 1×64 + 1×32 + 0×16 + 1×8 + 0×4 + 0×2 + 0×1.

Each binary digit represents the value of the digit multiplied by increasing powers of 2, from right to left. Most computers, microprocessors and micro-controllers, the Arduino is no exception, store information in chunks of eight bits, called bytes. As demonstrated above, to represent decimal 1000 in binary requires 10 bits of information. Since this information is stored in 8-bit bytes, 2 bytes of information, or 16 bits, are required to store a value ranging from 0 to 1000. So 1000 stored in binary in chunks of 8-bit bytes is

00000011 11101000

Where the byte on the left is the most significant byte containing the most significant bit also at the left. This is the first bit read from the sensor, and the byte on the right is the least significant byte containing the least significant bit, the last one read, completely at the right. The 16 bits returned by the DHT22 sensor device for a relative humidity of 100% are exactly as depicted, starting at the most significant bit, six zeroes, followed by 5 ones, then one zero, one one, and finally three zeroes.

Temperature

The next 16 bits of the 40 bit sequence contain the temperature. Temperature is in degrees Celsius and span from −40.0 degrees to 80.0 degrees. Temperatures from 0 to 80 degrees are stored the same way as relative humidity values are encoded. 80 degrees is encoded as 800 decimal or 1100100000 in binary which can be stored in 2 bytes as

00000011 00100000

What about negative numbers, values between -40.0 and 0.0 degrees Celsius? In early computers, negative numbers were identified by setting the most significant bit to 1. Hence, five was encoded in binary as 00000101 and minus five as 10000101. This worked, but it was not very convenient as each operation had to check for the value of the most significant bit to decide which operation to perform and because there were two values for zero, a minus zero, 10000000, and a plus zero, 00000000. Another method was devised, the two’s complement method for representing negative numbers. It consists in complementing the binary number, making all zeroes ones and all ones zeroes, and then adding one. For instance, the number five, encoded as 00000101, becomes 11111010 and, if we add one, 11111011. Using the two’s complement negative number representation, negative numbers can be also be identified with their most significant bit, the leftmost bit, set to one.

The interesting thing is this: if you add a number with its two’s complement, the result is zero, exactly what one would expect when adding a number and its negative. The two’s complement of a number that has been two’s complemented is the original number, again, what is expected. Finally, the two’s complement of zero is also zero. These properties of the two’s complement method for representing negative numbers correspond to the mathematical properties of negative numbers, making arithmetic operations straight forward. If Tc(n) is a function returning the two’s complement of a number, we get the following properties for binary operations along with the corresponding properties for arithmetic operations.

BinaryArithmetic
n + Tc(n) == 0n + (−n) = 0
Tc(Tc(n)) == n−(−n) = n
Tc(0) == 0−0 = 0

So, the DHT22 sensor representation of minus forty is as follows. First, let’s encode forty degrees as 400, ten times forty. The 16-bit binary representation of 400 is 00000001 10010000. To make it negative, we complement the number, making all zeroes ones and all ones zeroes getting 11111110 01101111, and then we add one, getting 11111110 01110000. Temperatures vary in the range from -40.0 degrees Celsius to 80 degrees Celsius which becomes in binary terms:

from 11111110 01110000 to 00000011 00100000.

Checksum

The final 8 bits sent by the DHT22 sensor contain a checksum. Checksums are a method to verify that the data sent is valid by making an arithmetic sum of all values sent and sending a truncated version of the sum last, allowing the receiving device to verify that data was transmitted correctly. The checksum sent by the DHT22 sensor is the sum of the first four 8-bit bytes truncated to the least significant 8 bits. After receiving all 40 bits of data from the sensor, the Arduino program computes the sum of the first four 8-bit bytes, truncates the result to the least significant 8 bits and compares the value to the checksum sent by the sensor. If the values match, the data is deemed valid.

Connecting the DHT22 to an Arduino

The following picture depicts how to connect the different parts using a solderless breadboard, jump wires, and a DHT22 temperature and relative humidity sensor. The sensor’s lead 1, the leftmost one, is connected the 5 volts supply, lead 4, the rightmost one, is connected to the supply’s ground, and lead 2, the signal lead, is connected to digital I/O pin 2.

The Program

The purpose of the program is simple, read temperature and relative humidity from the DHT22 sensor and return the information to the connected computer. The following shows the content of the main sketch which can be found, along with the DHT22 access class, on GitHub.

/*
  DHT22 Temperature / Humidity Serial Decoder Sketch
  Program that requests temperature and humidity from a DHT22 sensor
  and returns the results to the serial port. It is associated with
  the Serial Communication with a Temperature Sensor blog post on
  https://lagacemichel.com
  MIT License
  Copyright (c) 2020, Michel Lagace
*/

#include "DHT22.h"

// DHT serial input/output port
#define DHT22_PORT 2

// Create DHT22 device instance
DHT22 dht(DHT22_PORT);

// Setup the board.
void setup() {
  Serial.begin(9600);
}

// This is the main loop. It requests for a transmission, decodes
// the signal and displays decoded temperature and humidity.
void loop() {
  // Get relative humidity and temperature
  float relativeHumidity = dht.relativeHumidity();
  float temperature = dht.temperature();

  // Send results back to PC
  Serial.print("T: ");
  Serial.print(temperature,1);
  Serial.print("C RH: ");
  Serial.print(relativeHumidity,1);
  Serial.println("%");
  delay(5000);
}

First, the Arduino sketch file starts with a comment stating the purpose of the program, the author and a copyright notice. The program is licensed under the standard MIT license. Next, we include the “DHT22.h” file which declares the DHT22 class. We will cover the content of this file later in this post. Classes and objects were discussed previously in the Programming with Class blog post. We then define the port to use to communicate with the sensor, DHT22_PORT and we instantiate an object of class DHT22, initializing it with the port just specified. The DHT22 object will handle all communications with the external sensor to provide the program with the temperature and relative humidity.

The setup() function sets up the serial communication to communicate with the PC at 9600 baud, or approximately 10 characters per second. In the main loop() function, we get the relative humidity and temperature from the instance of the DHT22 class using the relativeHumidity() and temperature() methods respectively. We then send the information back to the connected computer using the Serial interface’s print() and println() methods. Finally, the program waits five seconds, using the delay() function, before exiting the loop() function which will be repeatedly called forever.

The DHT22.h File

The DHT22.h header file defines the DHT22 class. C++ and .ino files that want to use objects of the DHT22 class must include this file using the ‘#include‘ statement. The header file contains the class definition that declares a destructor and a constructor using the port number to which the DHT22 sensor is connected in its public section. Two accessor methods, temperature()and relativeHumidity() are declared to return the floating point value of the temperature and relative humidity read from the sensor.

Follows a private section declaring the default constructor, the copy constructor and the assignment operator. They are made private to prevent their use. Then we declare three private methods, timeSinceLastRead(), waitForState(), and fetchData(), only accessible from within the class. These methods will be described later in the post. Finally, there is a private section containing the persistent data used within the class. This data includes an integer (int) holding the port number, m_port, used to communicate with the sensor, an array of five bytes (byte) m_data, to contain the forty bits read from the sensor, an unsigned long integer, m_lastRead, containing the last time, in milliseconds since the program started, data was read from the sensor, two floating point numbers (float), m_temperature and m_relativeHumidity, containing the last temperature and relative humidity read from the sensor, and a Boolean flag (bool), m_firstTime, used to indicate if the class instance has been previously used.

/*
  DHT22 Temperature / Humidity Controller Class Header
  DHT22 temperature and relative humidity sensor handling class. This class
  allows the instanciation of objects that communicate with a DHT22 sensor
  connected to a digital input/output port on an Arduino micro-controller.
  This code is associated with the Serial Communication with a Temperature
  Sensor blog post on https://lagacemichel.com
  MIT License
  Copyright (c) 2020, Michel Lagace
*/

#if !defined(DHT22_H)
#define DHT22_H

#include "Arduino.h"

class DHT22 {
  public:
    // Orthodox cannonical form
    ~DHT22(); // Destructor

    // Constructor connecting digital I/O port to DHT22 device
    DHT22(int port); // Constructor

    // Get temperature and relative humidity
    float temperature();
    float relativeHumidity();

  private:
    // Unusable and hidden orthodox cannonical form
    DHT22();  // Default constructor
    DHT22(const DHT22&); // Copy constructor
    DHT22& operator = (const DHT22&); // Assignment operator

    // Internal methods
    unsigned long timeSinceLastRead() const;
    int waitForState(bool state) const;
    void fetchData();
    

  private:
    int m_port;               // I/O pin connected to sensor
    byte m_data[5];           // Data read from DHT22 sensor
    unsigned long m_lastRead; // Last time data was read in milliseconds since program start
    float m_temperature;      // Temperature in degrees Celsius
    float m_relativeHumidity; // Relative humidity in %
    bool m_firstTime;         // Flag if first time around
};
#endif

The DHT22.cpp File

The “DHT22.cpp” file contains the implementation of the DHT22 class methods. It starts with the standard header with title, description, license and copyright notice in a comment. It then includes the class definition from header file “DHT22.h” and defines a few timing values that will be used throughout the code. The CYCLES_PER_COUNT definition is the number of CPU cycles that the waitForState() method uses on average every time it checks if the signal from the DHT22 sensor has achieved the desired level, HIGH or LOW. This value was measured as part of a separate benchmark program. The TIMEOUT_MICROSECONDS value is the maximum time, in microseconds, to wait for the desired level. The TIMEOUT value corresponds to the number of times the signal level needs to be checked to reach a timeout. The TIMEOUT value is defined using the F_CPU definition found in the “Arduino.h” header file. F_CPU defines the CPU frequency in cycles per second for the Micro Controller used. For the Arduino Uno, this value is 16,000,000. The last three definitions specify in milliseconds delay values of ONE_SECOND, TWO_SECONDS, and TWO_MILLISECONDS.

/*
  DHT22 Temperature / Humidity Controller Class Body
  DHT22 temperature and relative humidity sensor handling class. This class
  allows the instanciation of objects that communicate with a DHT22 sensor
  connected to a digital input/output port on an Arduino micro-controller.
  This code is associated with the Serial Communication with a Temperature
  Sensor blog post on https://lagacemichel.com
  MIT License
  Copyright (c) 2020, Michel Lagace
*/

#include "DHT22.h"

#define CYCLES_PER_COUNT 50
#define TIMEOUT_MICROSECONDS 300
#define TIMEOUT TIMEOUT_MICROSECONDS/CYCLES_PER_COUNT*F_CPU/1000000
#define ONE_SECOND 1000
#define TWO_SECONDS 2000
#define TWO_MILLISECONDS 2

DHT22 Class Constructor and Destructor

The class constructor initializes the DHT22 sensor port value, m_port, to the value passed as a parameter to the constructor. All data values in the m_data array are initialized to 0, the last time in milliseconds since the program started that the sensor was read, m_lastRead, is also initialized to 0. The first time through flag, m_firstTime, is set to true, and both floating point values for the temperature and relative humidity, m_temperature and m_relativeHumidity, are initialized to 0.0. The DH22 class destructor does not perform any action.

// DH22 constructor, accepts Arduino digital I/O port number
DHT22::DHT22(int port) {
  m_port = port;
  m_data[0] = 0;
  m_data[1] = 0;
  m_data[2] = 0;
  m_data[3] = 0;
  m_data[4] = 0;
  m_lastRead = 0;
  m_firstTime = true;
  m_temperature = 0.0;
  m_relativeHumidity = 0.0;
}

// DH22 destructor
DHT22::~DHT22() {
}

DHT22 Class Accessors

Accessors are the class methods used to access the DHT22 sensor temperature and relative humidity. Both methods call the fetchData() method to read information, if required, from the DHT22 sensor, then return the sought information. The temperature() method returns a floating point value representing the temperature in degrees Celsius and the relativeHumidity() method returns a floating point value representing the relative humidity as a percentage.

// Return temperature
float DHT22::temperature() {
  // Get data from sensor and return temperature read
  fetchData();
  return m_temperature;
}

// Return relative humidity
float DHT22::relativeHumidity() {
  // Get data from sensor and return relative humidity read
  fetchData();
  return m_relativeHumidity;
}

DHT22 Class timeSinceLastRead( ) Method

The timeSinceLastRead() method returns an unsigned long integer containing the time in milliseconds since the fetchData() method actually read data from the DHT22 sensor device. The fetchData() method stores the number of milliseconds since the program was started in variable m_lastRead every time it reads data from the sensor and it calls the timeSinceLastRead() method before attempting to read data from the sensor, ensuring that at least two seconds have elapsed since the last sensor device request.

The timeSinceLastRead() method first gets the current number of milliseconds since program start using the millis() function. It then checks if the value has overflowed, that is if the unsigned long value went further than the maximum value an unsigned long can hold. This value is actually 4,294,967,295, corresponding to approximately 49.7 days. After an overflow, the number of milliseconds since the program started restarts at zero. If an overflow occurs, time is computed by adding the two’s complement of the last time read corresponding to the time left to reach the overflow added to the number of milliseconds after the overflow, providing the actual number of milliseconds since the time was stored in m_lastRead. Two’s complement is computed by complementing the value, turning all ones into zeroes and all zeroes into ones using the unary bitwise not operator, ‘~‘, and then adding one. Otherwise, the method simply computes the difference between the current time and the last time m_lastRead was updated.

// Return the number of milliseconds since last time read
unsigned long DHT22::timeSinceLastRead() const {
  // Get current processor time
  unsigned long currentMilliseconds = millis();
  unsigned long timeSince = 0;

  // Check if time wrapped around, if so use two's complement
  if (currentMilliseconds < m_lastRead) {
    timeSince = ~m_lastRead + 1 + currentMilliseconds;
  }

  // Otherwise use difference
  else {
    timeSince = currentMilliseconds - m_lastRead;
  }

  // Return elapsed time
  return timeSince;
}

DHT22 Class waitForState( ) Method

The waitForState() method repeatedly checks if the DHT22 sensor data lead has reached the desired state, HIGH or LOW, as specified in the method’s parameter, state, or if a timeout has been reached. The method returns the number of times the sensor line has been checked, or 0 if a timeout occurred.

// Wait for serial line to reach a state and return relative time
int DHT22::waitForState(bool state) const {
  int count = 0;
  while ((bool)digitalRead(m_port) != state) {
    count++;
    if (count >= TIMEOUT) {
      count = 0;
      break;
    }
  }
  return count;
}

DFT22 Class fetchData( ) Method

The fetchData() method is the actual method that reads data from the DHT22 sensor, through the waitForState() method, and that computes the temperature and relative humidity. First, the method checks if this the first time the method is being called or if more than two seconds have elapsed since the last time sensor data has been read. If not, then the method does nothing and returns. If it is the first time the method is called, the DHT22 sensor port is put in input mode with a pull-up resistor for one second. Then, the port is put in OUTPUT mode, a LOW signal is sent for two milliseconds, then the port is put back in INPUT_PULLUP mode, providing a HIGH signal at the port, thus completing the request for data signal.

Next, we enter the time critical section of the code where we will be measuring the timing of the signal sent back by the DHT22 sensor. For the whole period of a maximum of approximately 3 milliseconds, we disable interrupts, allowing us to precisely compute time. Because the Arduino’s time computing functions require interrupts to be enabled, we use the number of CPU cycles spent detecting a change of state, between HIGH or LOW, within the waitForState() method. Interrupts are disabled using the noInterrupts() Arduino built-in function and re-enabled using the interrupts() Arduino built-in function.

While interrupts are disabled, the code first checks for the signal to go from HIGH to LOW, then from LOW to HIGH, and back to LOW again. This corresponds to the start of transmission signal from the DHT22 sensor. The low and high signals last 80 microseconds each but there is no need to check the timing except for timeouts. This is why we check for a positive integer everytime waitForState() is called in order to continue processing. After sending the start of of transmission, the DHT22 sensor proceeds with the forty bits of data. For each bit, the counter values for the signal to go from LOW to HIGH and then from HIGH to LOW are gathered from appropriate calls to the waitForState() method. If there are no timeouts, the bit value is stored in the appropriate byte as explained after the code listing below.

// Fetch data from sensor
void DHT22::fetchData() {
  // We will access sensor on the very first time and if more than two
  // seconds have passed since last access.
  if (m_firstTime || (timeSinceLastRead() > TWO_SECONDS)) {

    // First time around, wait at least one second for sensor to settle
    if (m_firstTime) {
      m_firstTime = false;
      pinMode(m_port, INPUT_PULLUP);
      delay(ONE_SECOND);
    }

    // Send request signal to reMad temperature and relative humidity from device.
    pinMode(m_port, OUTPUT);
    digitalWrite(m_port, LOW);
    delay(TWO_MILLISECONDS);
    pinMode(m_port, INPUT_PULLUP);

    // Since timings are critical, prevent interrupts while DHT22 transmits
    noInterrupts();

    // Get Start of Transmission, falling, rising, then falling edges
    // Interval: 80 micro-seconds, no need to check
    int lowCounter = 0;
    int highCounter = 0;
    highCounter = waitForState(LOW);
    if (highCounter > 0) {
      lowCounter = waitForState(HIGH);
      if (lowCounter > 0) {
        highCounter = waitForState(LOW);
      }
    }

    // Get 40 bits of data and store them in the data array
    if (highCounter > 0) {
      for (int bitN = 0; bitN < 40; bitN++) {     // 40 bits, 5 x 8-bit bytes
        lowCounter = waitForState(HIGH);          // Byte 0: Relative Humidity MSB
        if (lowCounter > 0) {                     // Byte 1: Relative Humidity LSB
          highCounter = waitForState(LOW);        // Byte 2: Temperature MSB
          if (highCounter > 0) {                  // Byte 3: Temperature LSB
            int byteN = bitN/8;                   // Byte 4: Checksum
            m_data[byteN] <<= 1;
            if (highCounter > lowCounter) {       // Low 50us, High 25us -> 0
              m_data[byteN] |= 1;                 // Low 50us, High 70us -> 1
            }
          }
        }
      }
    }
    // Reception complete, interrupts are re-enabled
    interrupts();

    // Save the time of last data transfer
    m_lastRead = millis();

    // Compute temperature and relative humidity if data is valid
    byte checksum = m_data[0] + m_data[1] + m_data[2] + m_data[3];
    if (m_data[4] == checksum) {
      m_relativeHumidity = int((m_data[0] << 8) + m_data[1])/10.0;
      m_temperature = int((m_data[2] << 8) + m_data[3])/10.0;
    }
    else {
      m_relativeHumidity = 0.0;
      m_temperature = 0.0;
    }
  }
}

In the middle of the loop that gathers the 40 bits above, we get the number of counts for which the signal is LOW and the number of counts for which the signal is HIGH in the lowCounter and highCounter variables respectively. As explained previously, the corresponding bit is ‘0‘ if highCounter is smaller than lowCounter and ‘1‘ if highCounter is greater than lowCounter. Each sequence of 8 bits is stored in its own byte in the m_data array, first bit read in the byte’s most significant bit. Bits 0 to 7 are stored in m_data[0], bits 8 to 15 in m_data[1], and so on. We determine in which m_data array element to store a bit by dividing the bit number, bitN, by 8 since there are 8 bits in each byte. Once we know which m_data array element to store the bit in, we do two operations. First we push the bits already in the array element by one bit to the left using the shift left operator (‘<<=‘). This is equivalent to multiplying the data by 2, pushing all bits to the left and setting the least significant bit to 0. If highCounter is larger than lowCounter, we then set the least significant bit of the array element to 1 using the ‘or’ binary operator, ‘|=‘. The ‘or’ operator takes each bit in the array element and performs an ‘or’ operation with each bit of the operand, in this case 1, or 00000001 in binary. If both bit values are ‘0‘ then the result is ‘0‘. If any of the bit values are ‘1‘ then the resulting bit is ‘1‘. At the end of the loop, all 40 bits are stored in the m_data array.

As soon as interrupts are re-enabled, we store the current time in m_lastRead, which will prevent the sensor from being read for the next two seconds. Finally, we compute the checksum of the first four bytes received from the sensor and compare it to the 5th byte received, the sensor checksum. If checksums match, we compute the temperature and relative humidity by creating a 16 bit unsigned value, shifting the most significant byte 8 bits to the left and adding the least significant byte. We then convert the number to a signed integer, and divide the signed number by 10.0, automatically converting the result to a floating point value. The temperature and relative humidity values are saved in the m_temperature and m_relativeHumidity variables respectively for future use. If there was a checksum error, both temperature and relative humidity values are set to 0.0.

Putting It to Work

Build the circuit shown above and connect the Arduino Uno to your computer using a USB cable. On the computer, within the Arduino IDE, compile and download the sketch then press the control, shift, and M keys simultaneously. This will make the Serial Monitor window appear. Every five seconds, the Arduino program will send the current temperature and humidity as a character string back to the computer. The text is displayed on the Serial Monitor window and the output should look like the following: